前言
- 对于整个微服务系统而言。一套及时的报警通知,可视化监控,是必不可少的。
整体架构图
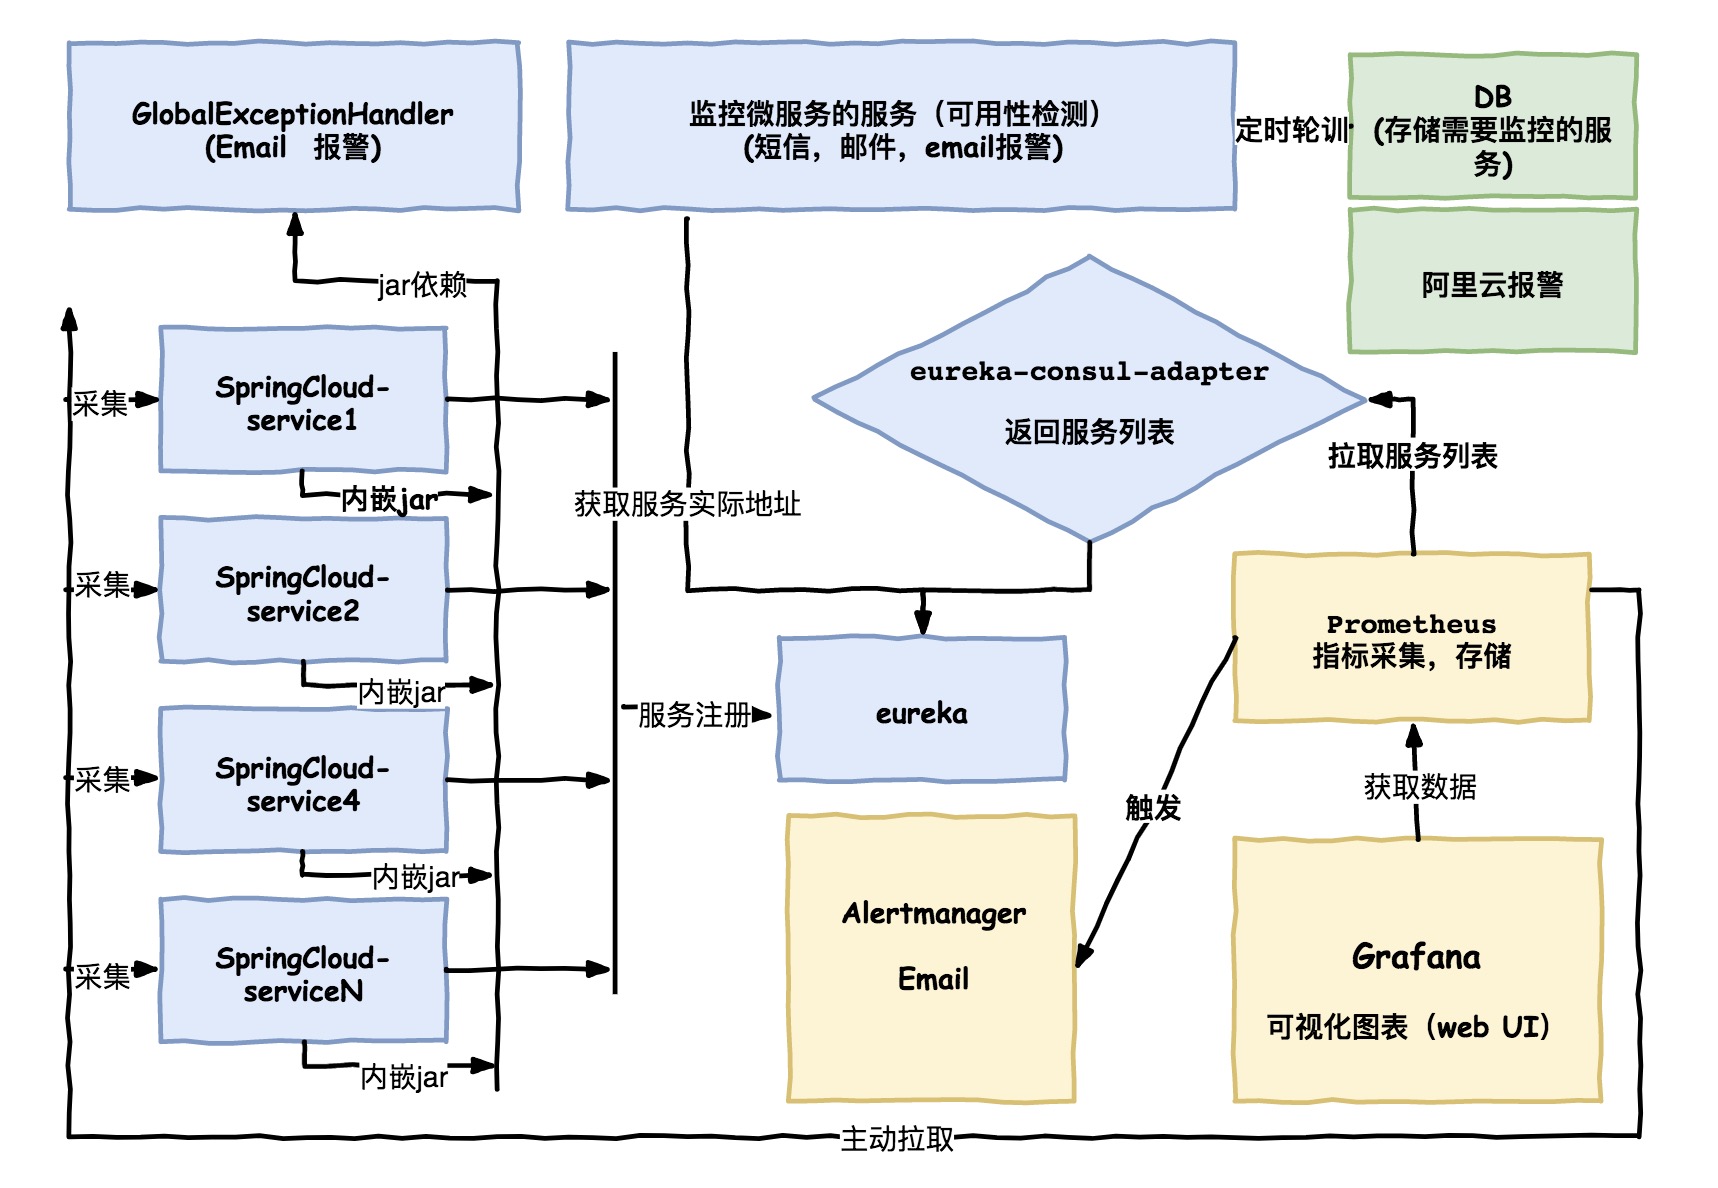
全局异常处理器
- 在我们的微服务中,所有的业务在进行实际操作之前都会进行业务的防御性校验。
- 如果发现发生一些意外情况,我们通过向上抛出业务异常的的方式进行传递。
- 在整个业务开发过程中,会有大量的业务校验不通过或者不满足的情况发生,这时候我们需要提示给到用户,给调用方,通知哪个环节使用的不合理导致问题。
比如以下场景:
- 用户添加了已经下架的商品到购物车
1
2
3
|
if (!product.getIsOn()) {
  throw new BizException("商品已下架,不能加入购物车");
}
|
1
2
3
4
|
if (!product.getIsOn()) {
  cartItemMapper.deleteByProjectIdAndUserIdAndSkuId(projectId, userId, skuId);
  throw new BizException("该商品已下架,已自动从购物车移除");
}
|
1
2
3
|
if (orderStatus != Order.OrderStatus.待支付) {
	throw new BizException("只有待支付订单才能取消");
}
|
- 当遇到业务校验不通过时,因为有全局异常处理器兜底,我们只需要向上抛出我们的业务异常即可。
带来的好处
- 首先是业务代码中完全将
异常业务流程和正常业务流程进行了完全的分离,代码的可读性大大提高。
- 其次避免了写业务逻辑时的不清楚到底在 哪层进行try catch,哪层代码不try catch。避免了在业务代码中由于每个人理解不懂导致的凌乱的try catch。
- 第三,异常被统一管理起来了,可以进行方便的统一处理,比如,我们可以在发生异常的时候,发送邮件告诉到我们的负责这个业务的小哥(这其实也是完成DevOps自动化链中必不可少的一环)。可以统一处理返回到用户到调用端的payload。
- 第四,对于具体的业务而言通过basejar的引入就能完成自动的激活和配置。任何特殊要求。可控性高。
GlobalExceptionHandler
 1
 2
 3
 4
 5
 6
 7
 8
 9
10
11
12
13
14
15
16
17
18
19
20
21
22
23
24
25
26
27
28
29
30
31
32
33
34
35
36
37
38
39
40
41
42
43
|
@RestControllerAdvice
@Slf4j
@EnableConfigurationProperties(GlobalExceptionHandler.EmailProperties.class)
public class GlobalExceptionHandler {

    @ExceptionHandler(Exception.class)
    @ResponseStatus(HttpStatus.INTERNAL_SERVER_ERROR)
    public Result handleException(Exception e, HttpServletRequest request, HttpServletResponse response) {
        writeHeader(response);
        e = findEx(e);
        handleCommon(e, request);
        return Result.builder().code(SysException.FINAL_CODE).message(e.getMessage()).build();
    }

    // 您的其他异常类型处理器 ....


    private Exception findEx(Throwable throwable) {
        if (throwable == null) return null;
        while (true) {
            if (throwable.getCause() == null) {
                return (Exception) throwable;
            } else {
                throwable = throwable.getCause();
            }

        }
    }

    private void handleCommon(Throwable e, HttpServletRequest request) {
        final String message = "host:" + MyUtils.getHost() + ", uri:" + request.getRequestURI() + ", referrer:" + request.getHeader(HttpHeaders.REFERER);
        // 过滤你的不发送邮件的异常
        if (e != null && !(e instanceof BizException)) {
            // 这里我们使用queue的offer方法 如果队列满了直接丢弃
            emailQueue.offer(EmailMate.builder().message(message).throwable(e).build());
        }
        log.error(message, e);
    }

    private void writeHeader(HttpServletResponse response) {
        response.setHeader(HttpHeaders.CONTENT_TYPE, MediaType.APPLICATION_JSON_VALUE);
    }
}
|
微服务监控服务
- 由于相关性比较大,所以不方便贴代码,这里简单说一下思想的思路。
- 首先是又个地方存放需要监控的服务名,端口号,需要检测的Uri。该URL最好是能访问到DB。redis等等。
- 然后是检测服务这个服务的高可用性,可以用zk选主的机制来保证。
- 然后是发送提醒的间隔,以及业务恢复正常之后的的提醒。
可视化监控
Prometheus 是什么
截取github上的原句The Prometheus monitoring system and time series database. ,可知是携监控和时序数据库一体的新一代开源解决方案,SoundCloud开源,2016 年,Prometheus 正式加入 Cloud Native Computing Foundation,成为受欢迎度仅次于 Kubernetes 的项目,目前在github 已经有2w+ star。
主要特性:
- 强大的社区,和丰富的插件,为我们的应用接入提供了极大的方便。
- 采用http协议通信,采用pull的模型,极大的减少了对应用的侵入性。比如我们的springcloud微服务,只需要导入相关jar包即可。
- 支持动态配置和服务发现。比如从consul和eureka读取我们的微服务list和detail。
使用docker安装Prometheus
- prometheus的安装通过一条promethues即可完成,根据自己的容器管理工具进行对应的调整即可
1
|
docker run -d -p 9090:9090 --name prometheus -v /etc/prometheus/prometheus.yml:/etc/prometheus/prometheus.yml prom/prometheus --config.file=/etc/prometheus/prometheus.yml
|
- 对于prometheus.yml的配置,由于它天生对eureka并不提供服务发现的机制的支持,这里我们需要使用一个适配器来支持服务发现。
- 这里我们使用eureka-consul-adapter来支持。
- 使用起来也很简单,只需要在eureka中添加gav依赖坐标即可
1
2
3
4
5
|
<dependency>
    <groupId>at.twinformatics</groupId>
    <artifactId>eureka-consul-adapter</artifactId>
    <version>${eureka-consul-adapter.version}</version>
</dependency>
|
 1
 2
 3
 4
 5
 6
 7
 8
 9
10
11
12
13
14
15
16
17
18
19
|
# 获取所有服务
freemandeMBP:opt freeman$ curl -i http://192.168.0.204:8761/v1/catalog/services

{"ACTIVITY-SERVICE":[],"ADDRESS-SERVICE":[],"ADMIN-ZUUL-GATEWAY":[],....}

# 获取单个服务详细
freemandeMBP:opt freeman$ curl -i http://192.168.0.204:8761/v1/catalog/service/ACTIVITY-SERVICE

[{
	Address: "192.168.0.204",
	Node: "ACTIVITY-SERVICE",
	ServiceAddress: "192.168.0.204",
	ServiceID: "4c53000573c9:activity-service:8044",
	ServicePort: 8044,
	NodeMeta: {
		management.port: "8044"
	},
	ServiceTags: []
},....]
|
- 通过之后我们就可以使用服务发现来机制来让prometheus自动发现我们的微服务,进行指标的采集了。
- prometheus.yml的配置如下,其中metrics_path是固定约定好的,server填写的是任意一台eureka的地址和端口
 1
 2
 3
 4
 5
 6
 7
 8
 9
10
11
12
13
14
15
16
17
18
19
20
21
22
23
24
25
26
27
28
29
30
31
32
33
34
35
36
37
38
39
40
41
|
global:
  scrape_interval: 15s # Set the scrape interval to every 15 seconds. Default is every 1 minute.
  evaluation_interval: 15s # Evaluate rules every 15 seconds. The default is every 1 minute.
rule_files:
  - "first_rules.yml"
scrape_configs:
  - job_name: "prometheus"
    static_configs:
      - targets: ["localhost:9090"]
  - job_name: "micro-service"
    consul_sd_configs:
      - server: "eureka1:8761"
    metrics_path: /actuator/prometheus
    relabel_configs:
      - source_labels: ["__meta_consul_service"]
        regex: "consul"
        action: drop
      - source_labels: ["__meta_consul_tags"]
        regex: ",(management),"
        action: drop
      - source_labels: [__address__]
        separator: ":"
        regex: "(.*):(8080)"
        target_label: __address__
        replacement: "${1}:8090"
      - source_labels: ["__meta_consul_service"]
        regex: "(.*)"
        target_label: "job"
        replacement: "$1"
      - source_labels: ["__meta_consul_service"]
        regex: "(.*)"
        target_label: "application"
        replacement: "$1"
      - source_labels: ["__meta_consul_service_id"]
        regex: "(.*)"
        target_label: "instance"
        replacement: "$1"
      - source_labels: ["__meta_consul_tags"]
        regex: ",(prod|test|dev),"
        target_label: "group"
        replacement: "$1"
|
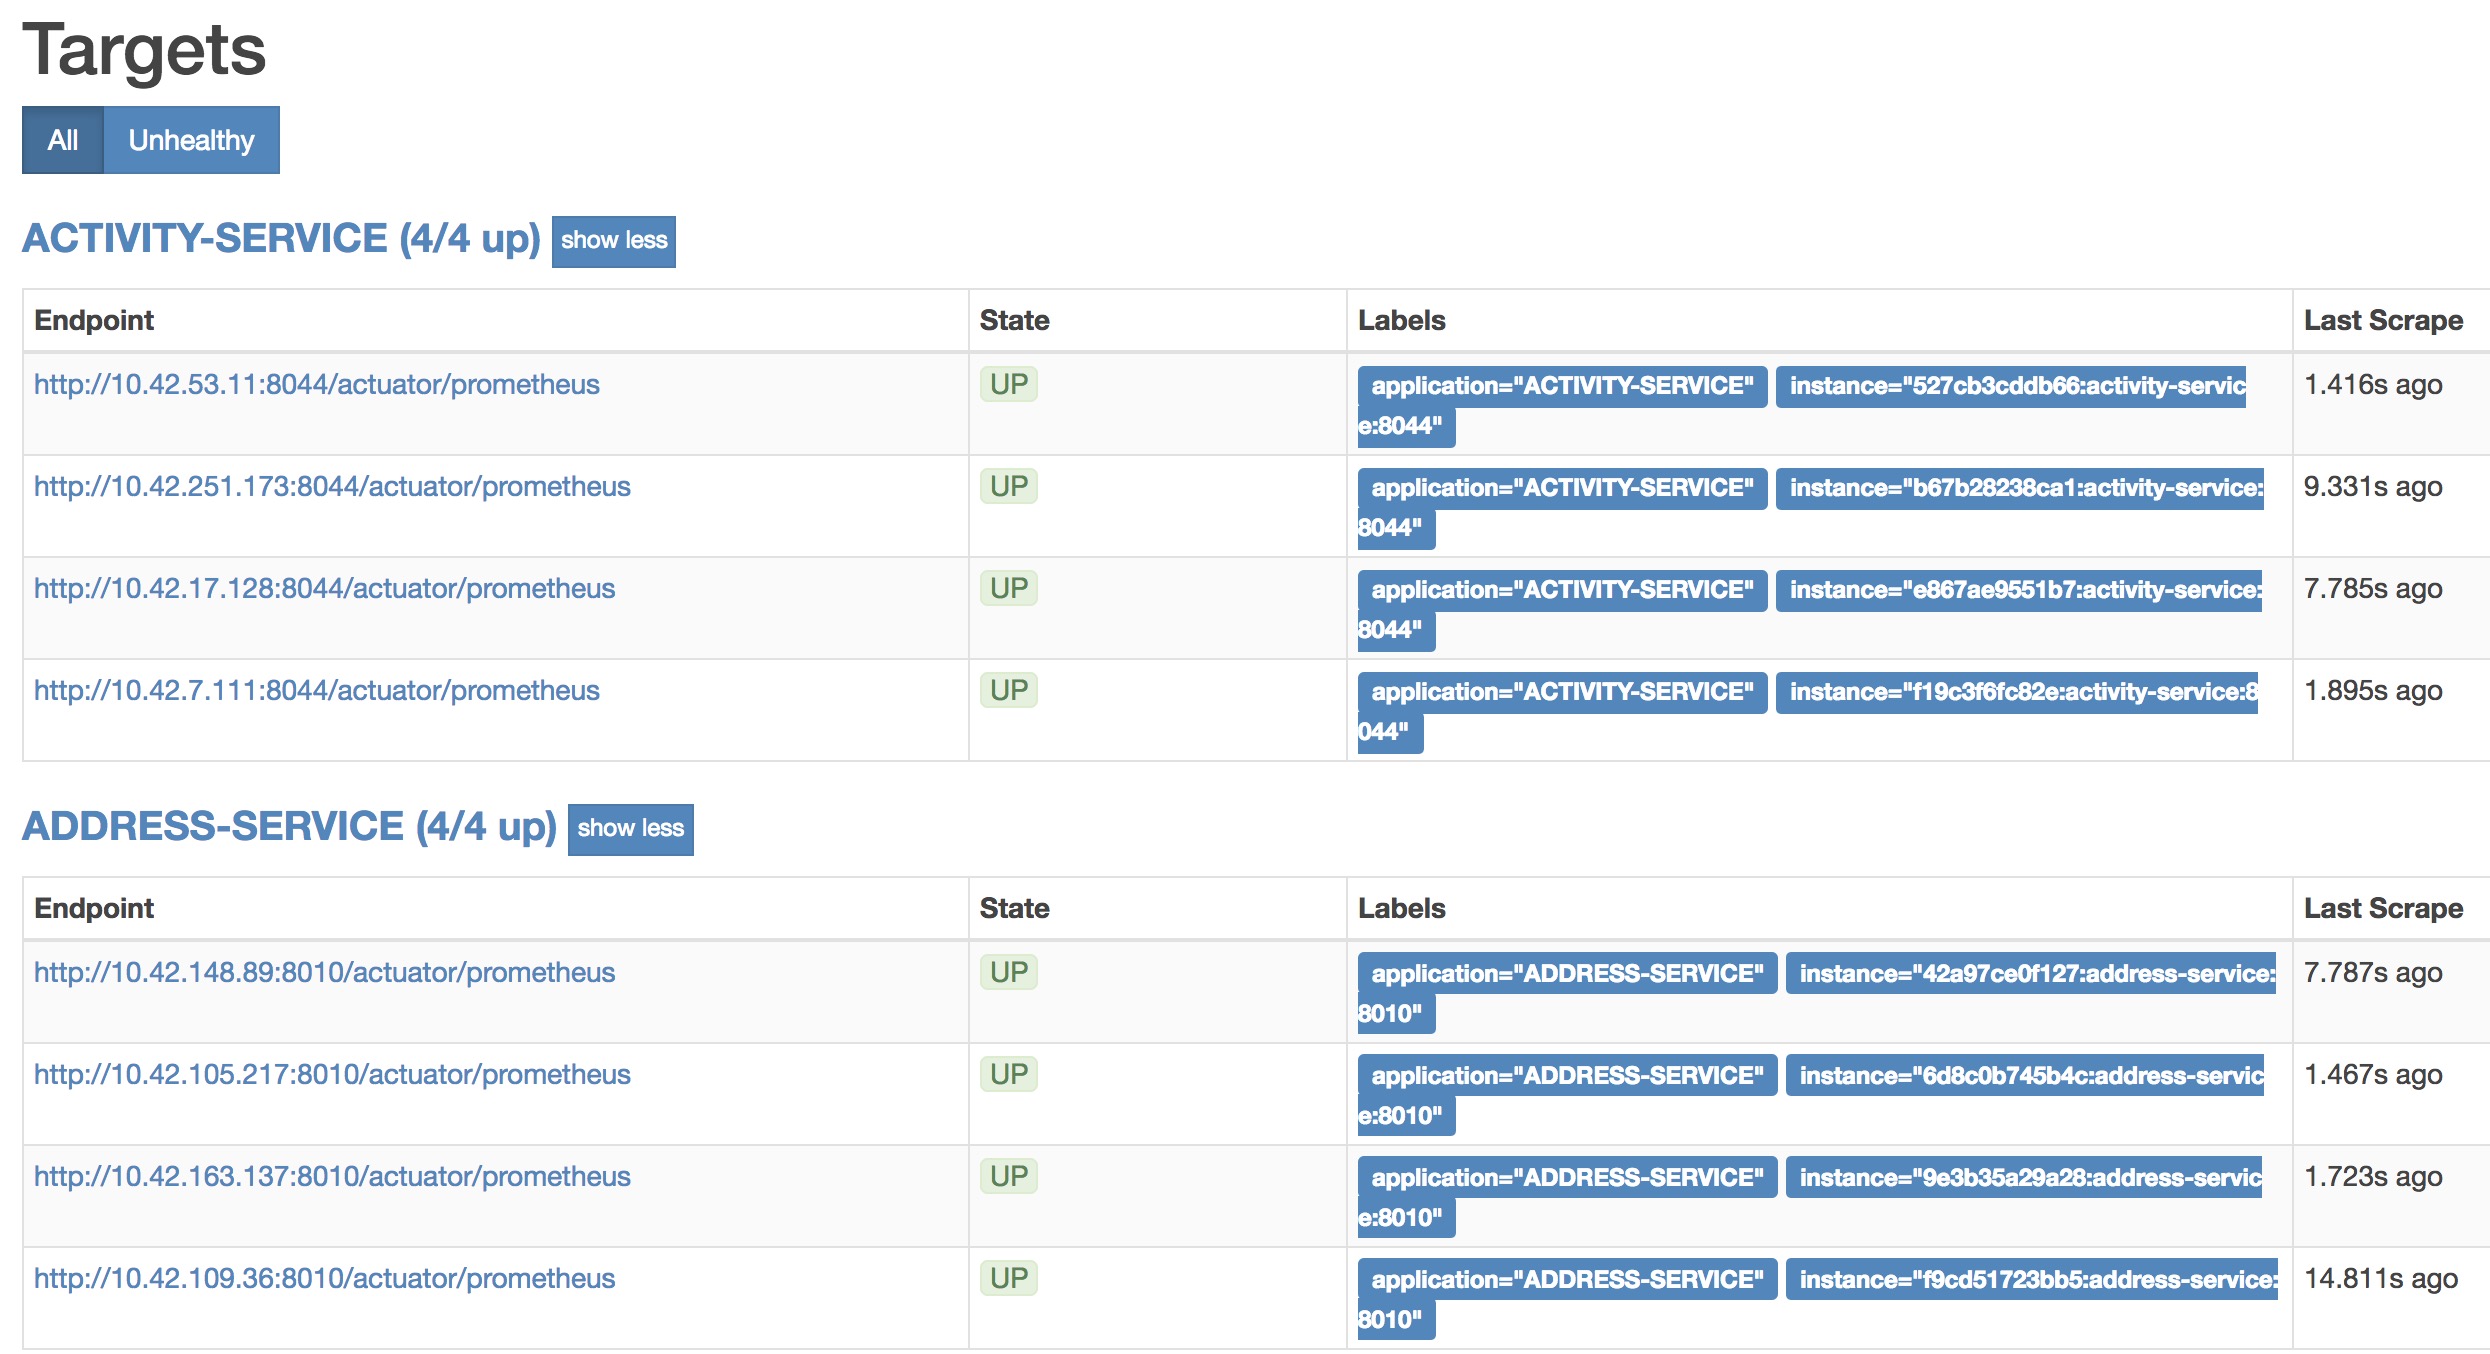
- 现在我们来验证下prometheus的服务发现是否正确的发现我们需要采集的微服务节点
- 打开浏览器访问
http://你的prometheus服务ip:端口/targets 如果配置正确你将看到你的微服务列表,表示我们的promuethus和springcloud服务发现整合完毕了。
Grafana
简介
- Grafana是一个可视化面板(Dashboard),有着非常漂亮的图表和布局展示,以及丰富的dashboard模板,功能齐全的度量仪表盘和图形编辑器,支持Prometheus作为数据源。
- 这里我们使用前面配置好的Prometheus作为Grafana的DataSource。
使用docker安装Grafana
- 官网有提供安装指南
- 一般使用如下docker命令即可完成安装
1
|
docker run -d -p 3000:3000 grafana/grafana
|
- 安装完成之后,访问
http://ip:3000 就可以看到UI界面了,第一次登录需要设置下admin账号密码。设置下即可
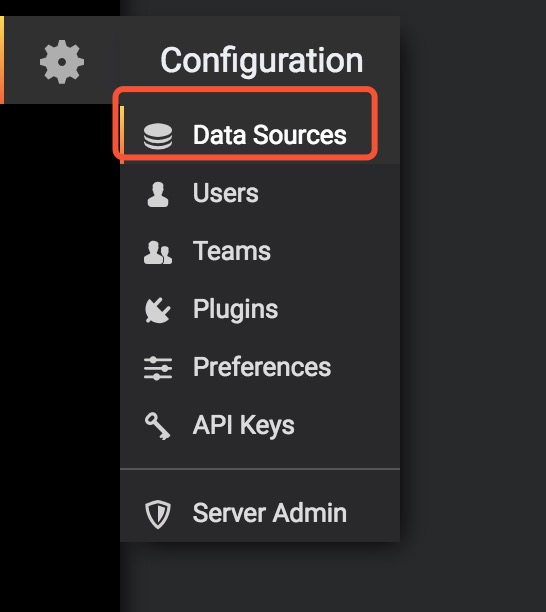
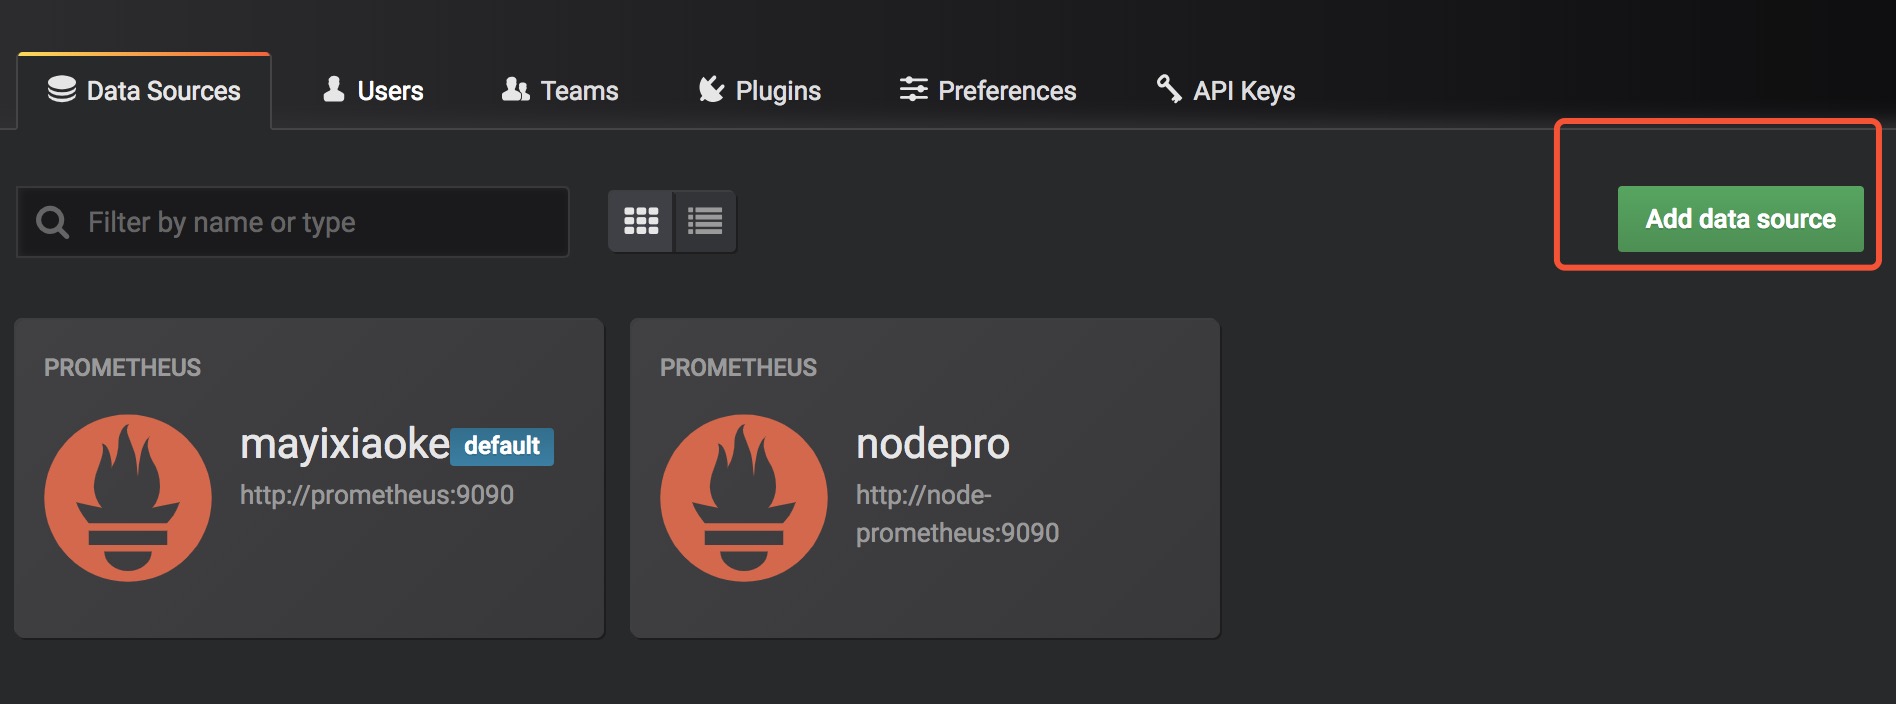
添加数据源
- 找到如下setting,选择DataSource
- 选择添加DataSource
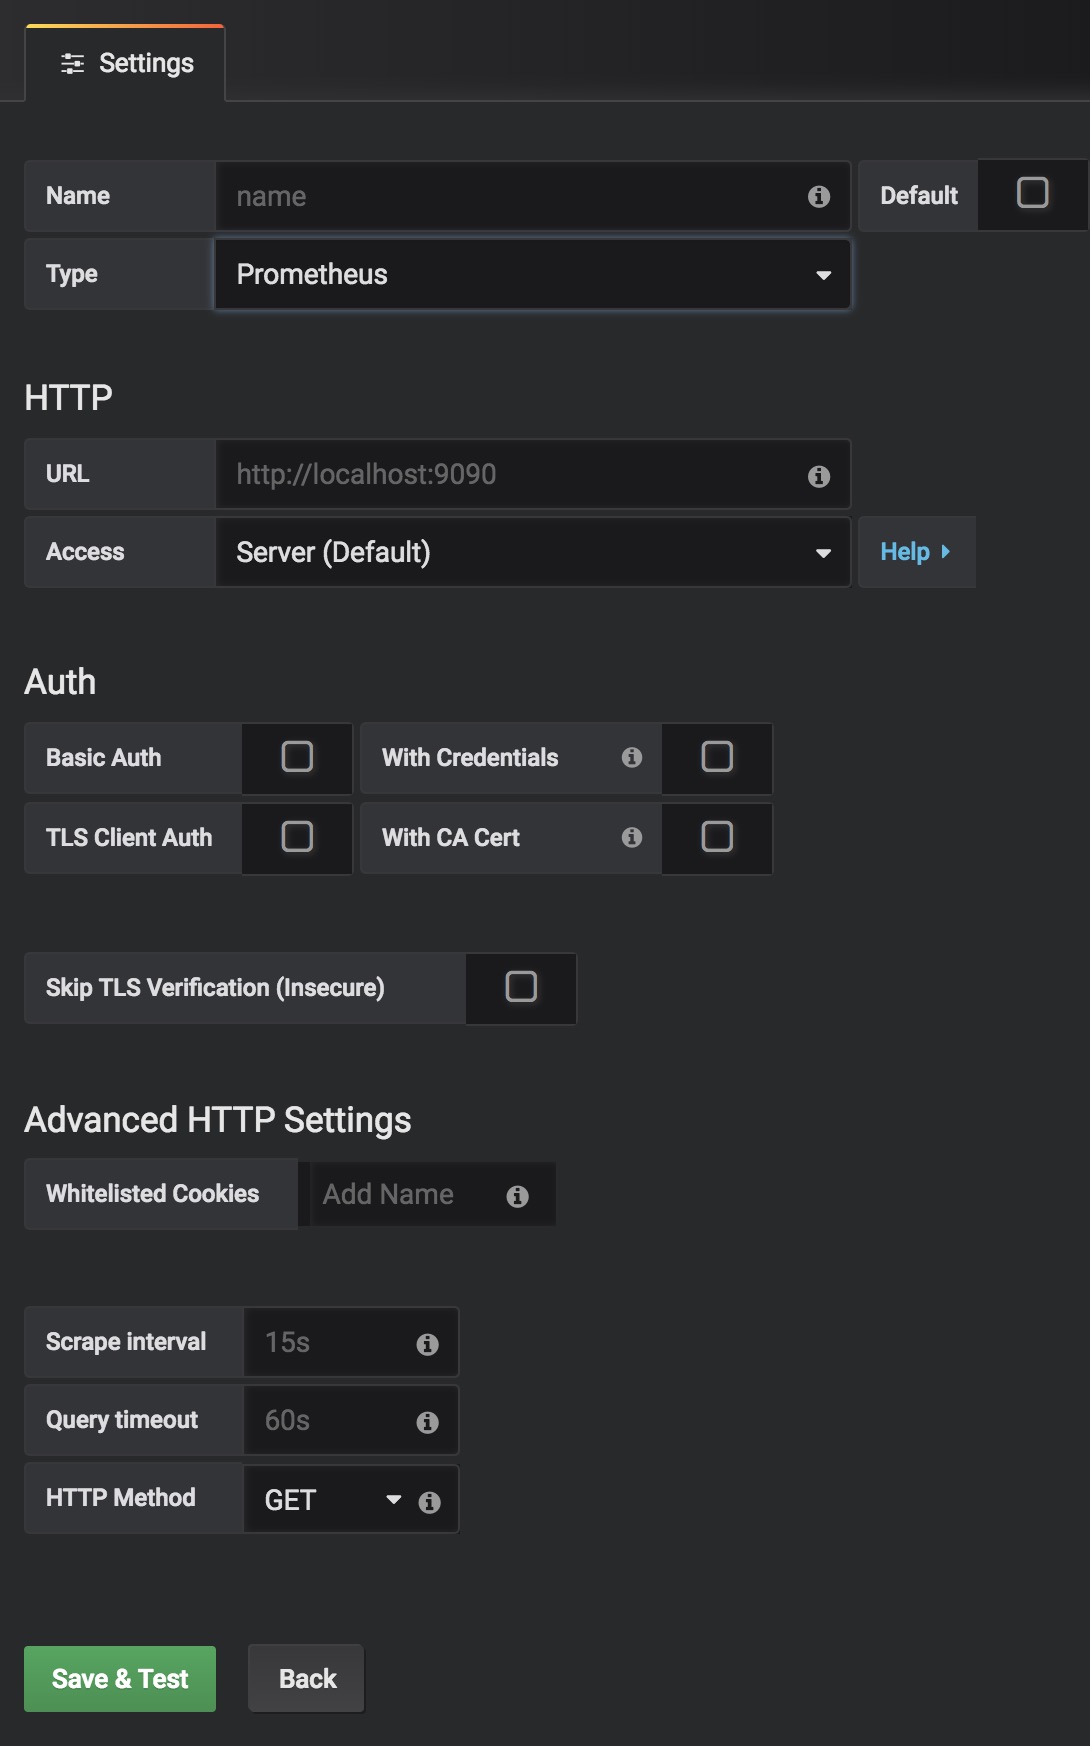
- type选择Prometheus
- URL填入你的Prometheus的ip:port 注意使用完整的http协议开头。如http://prometheus:9090
- 其余的如无特殊设置可不填写。直接点击Save&Test即可完成数据源的添加。
添加spring dashboard
- 选择create -> Import -> 填入如下下面的json
- 本模板由 模板id
6756 修改而来 你可以点击这里查看原生模板,修改后的模板
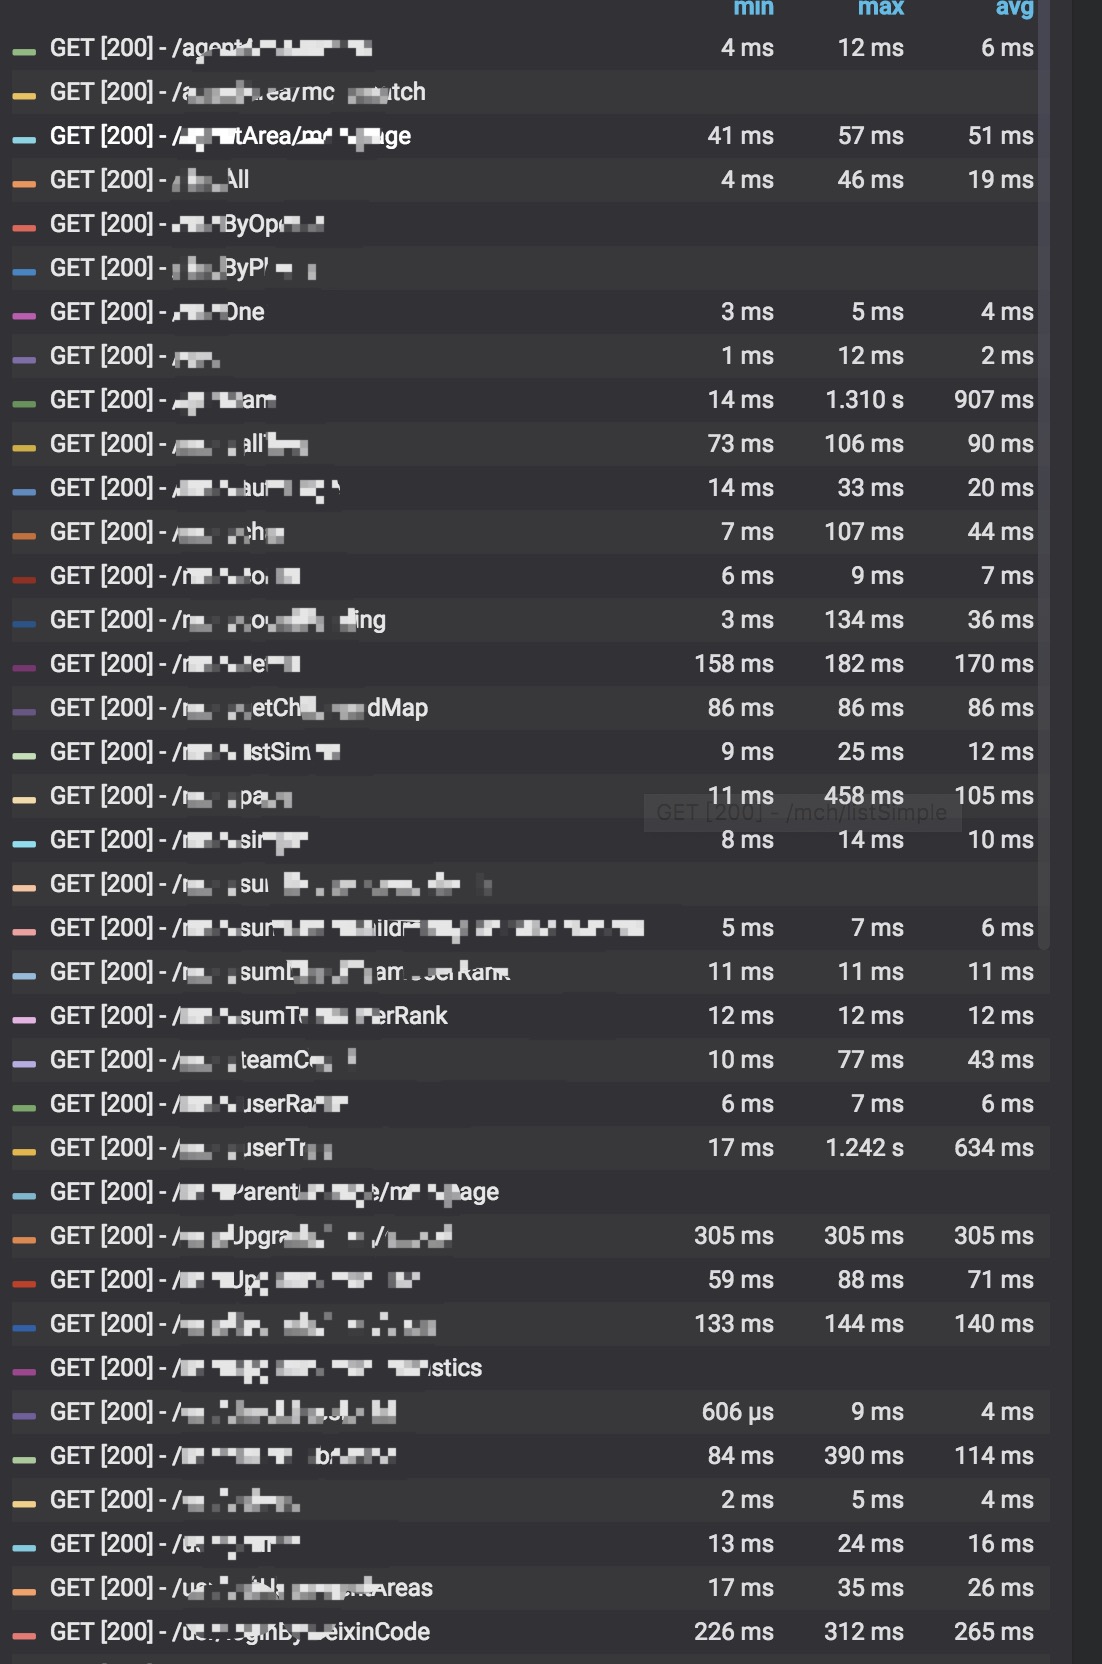
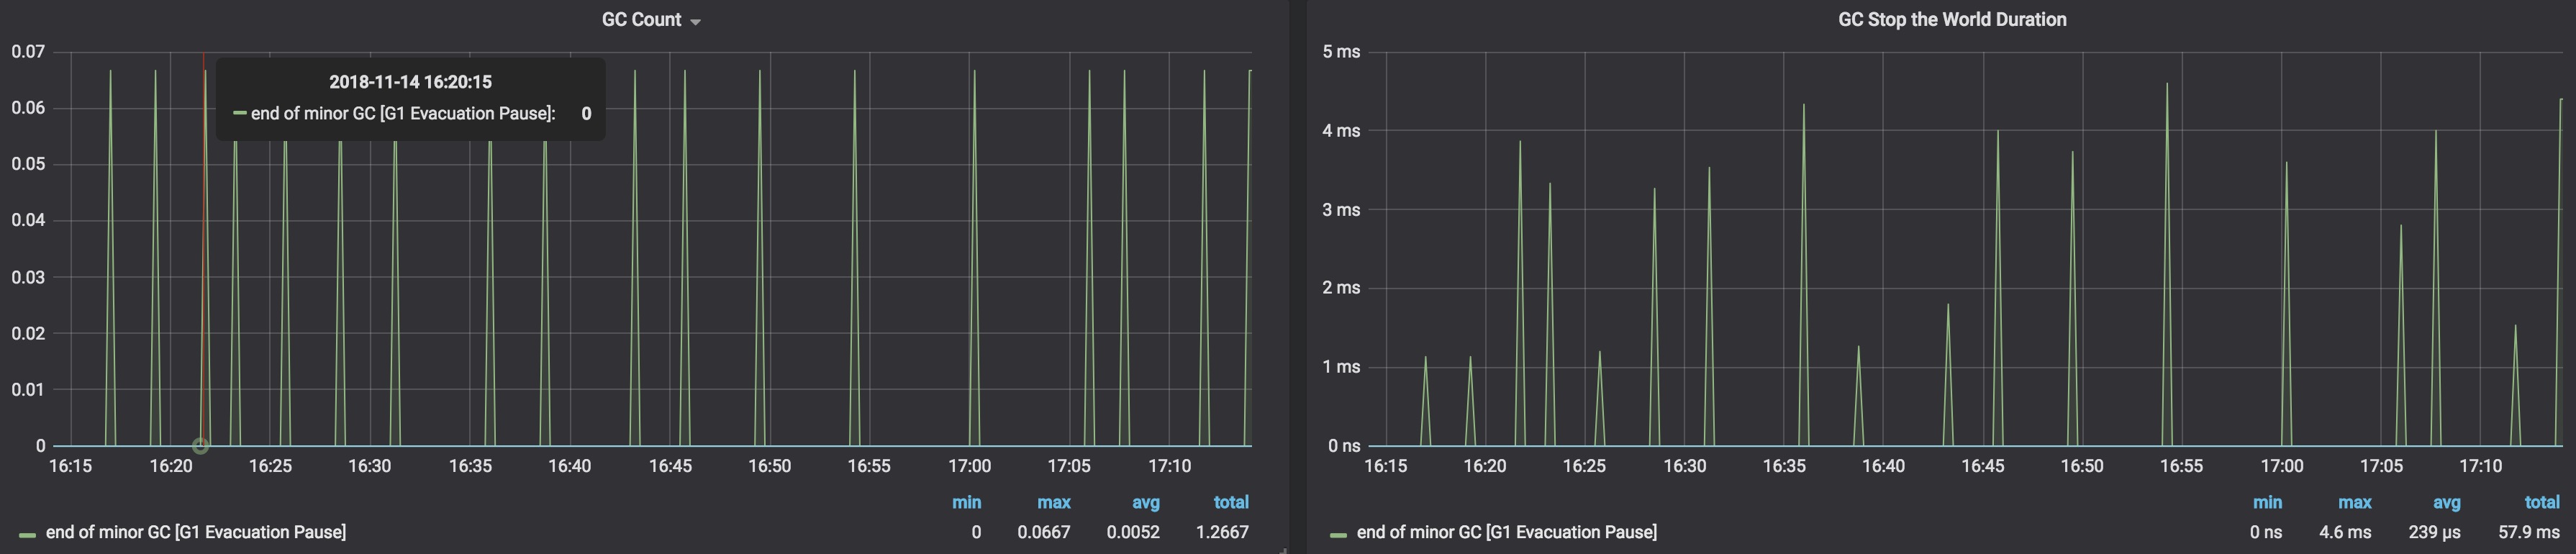
效果展示
- 存走势
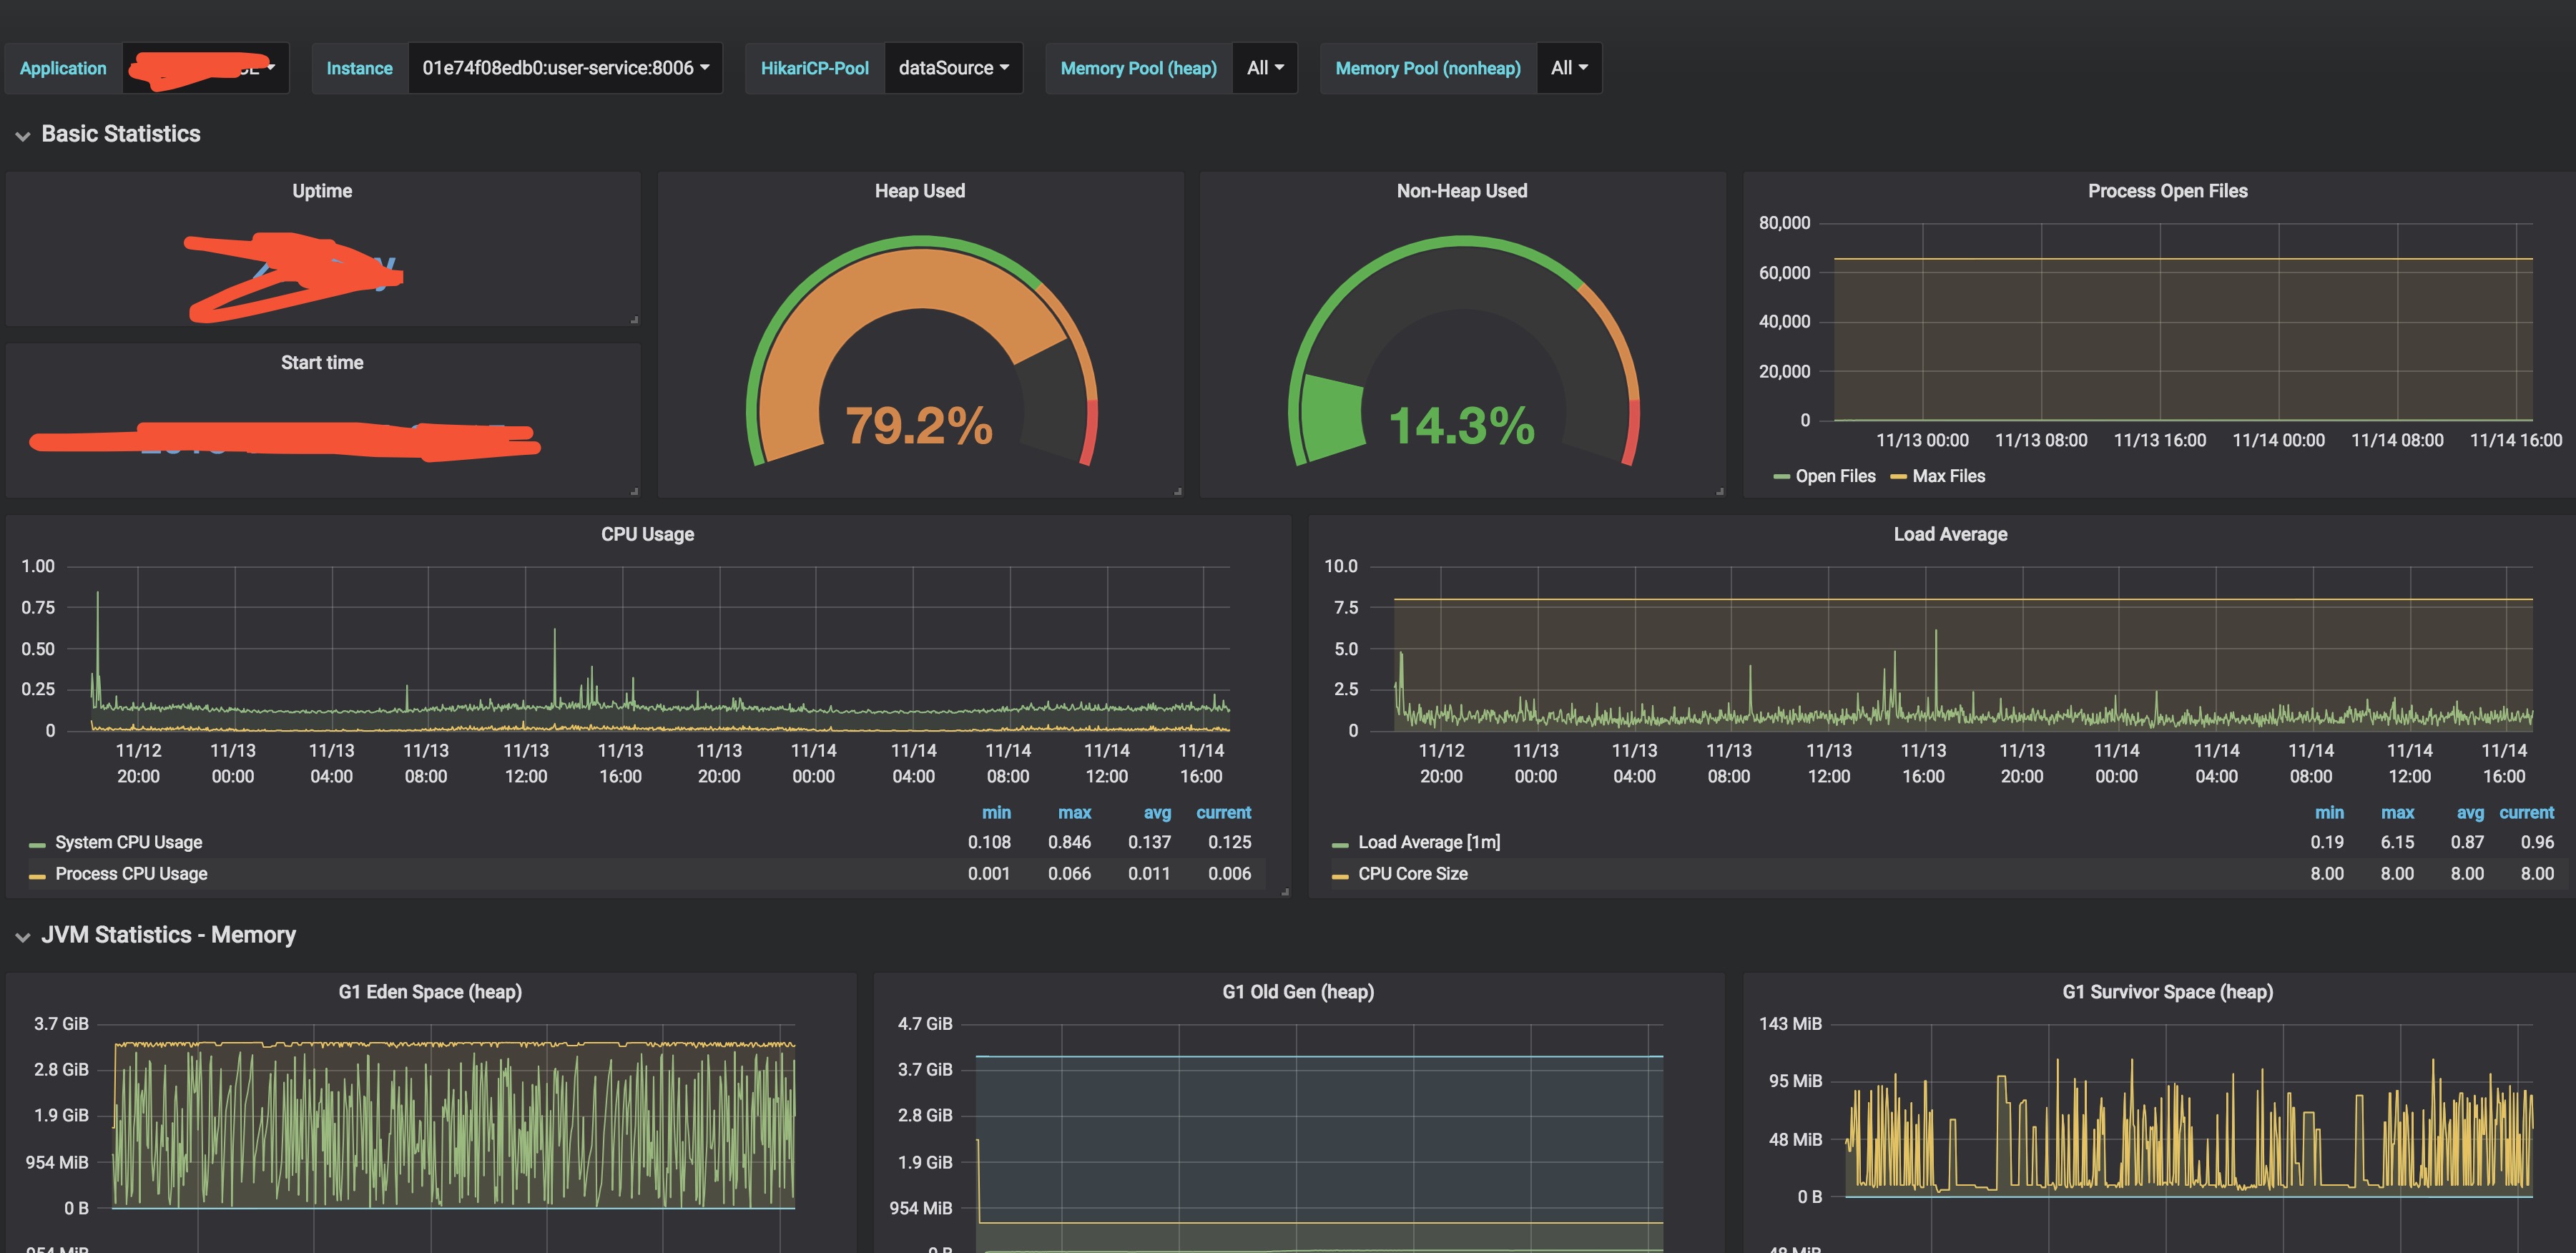
- G1GC SWT
- HTTP Reponse Time